Article
Bernoulli Distribution
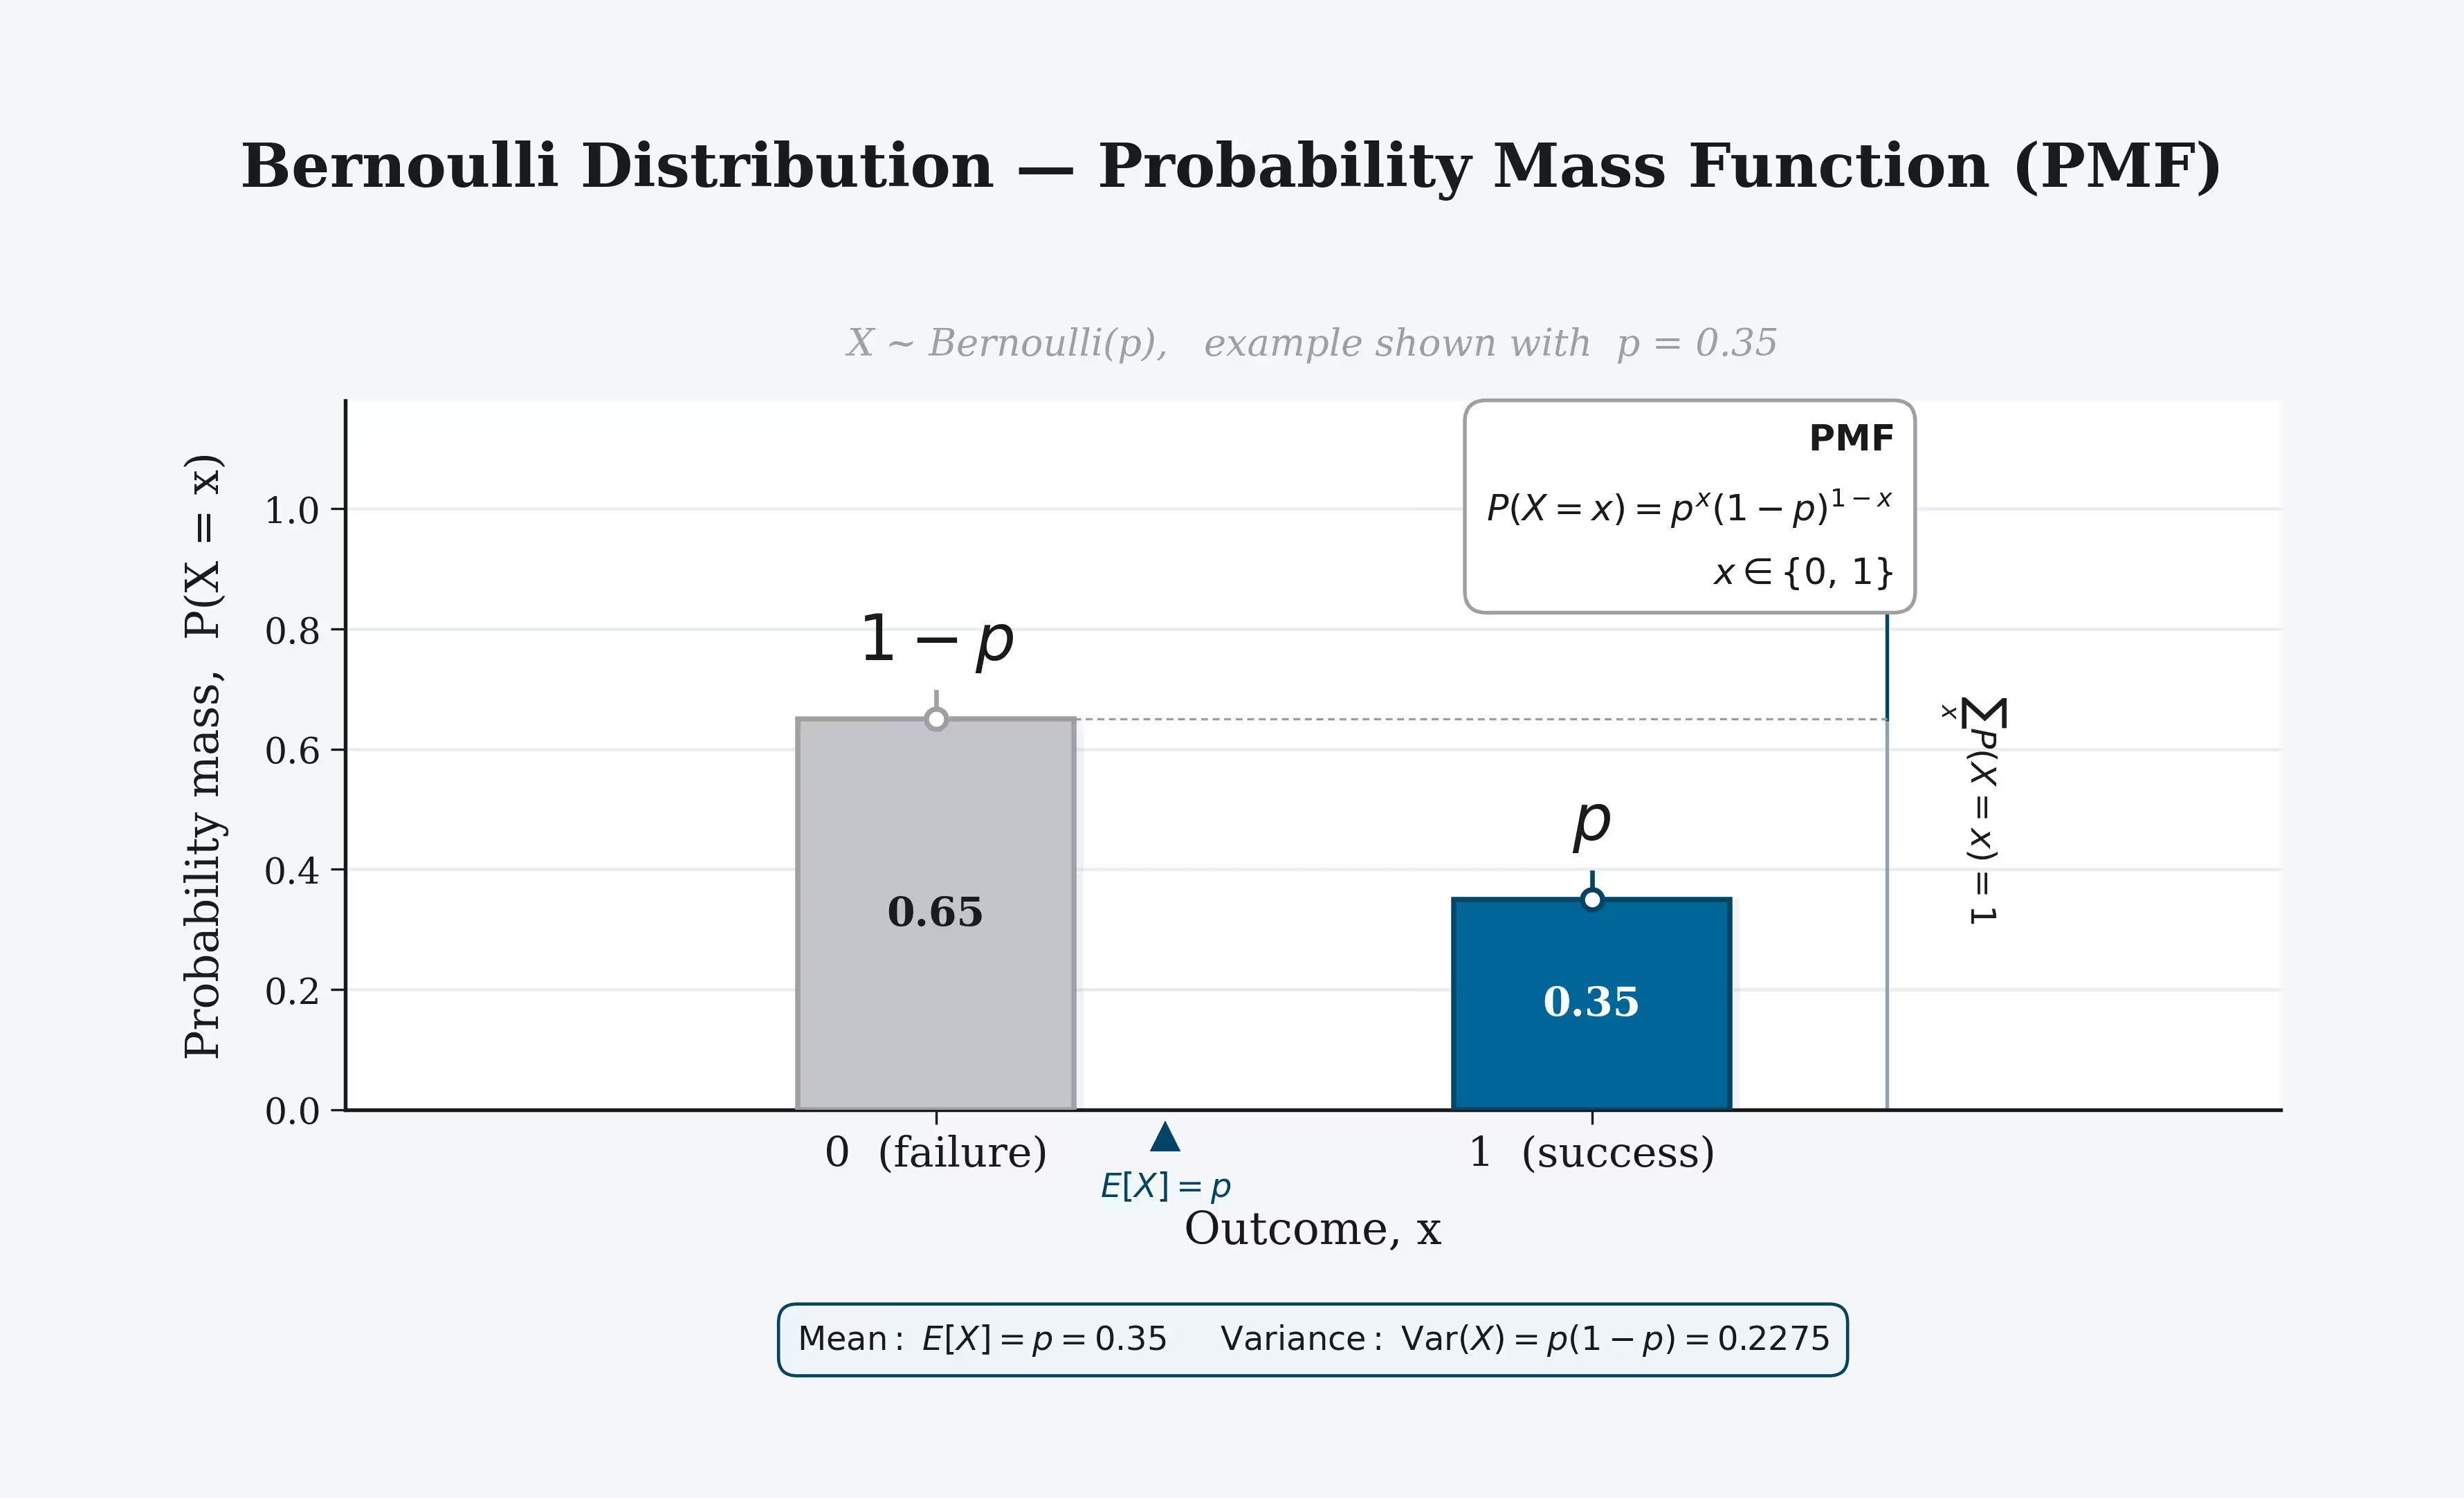
The mean of a bernoulli distribution, also called the expected value, represents the long run average outcome of repeated independent trials.
Read MoreThe mean of a bernoulli distribution, also called the expected value, represents the long run average outcome of repeated independent trials.
Read More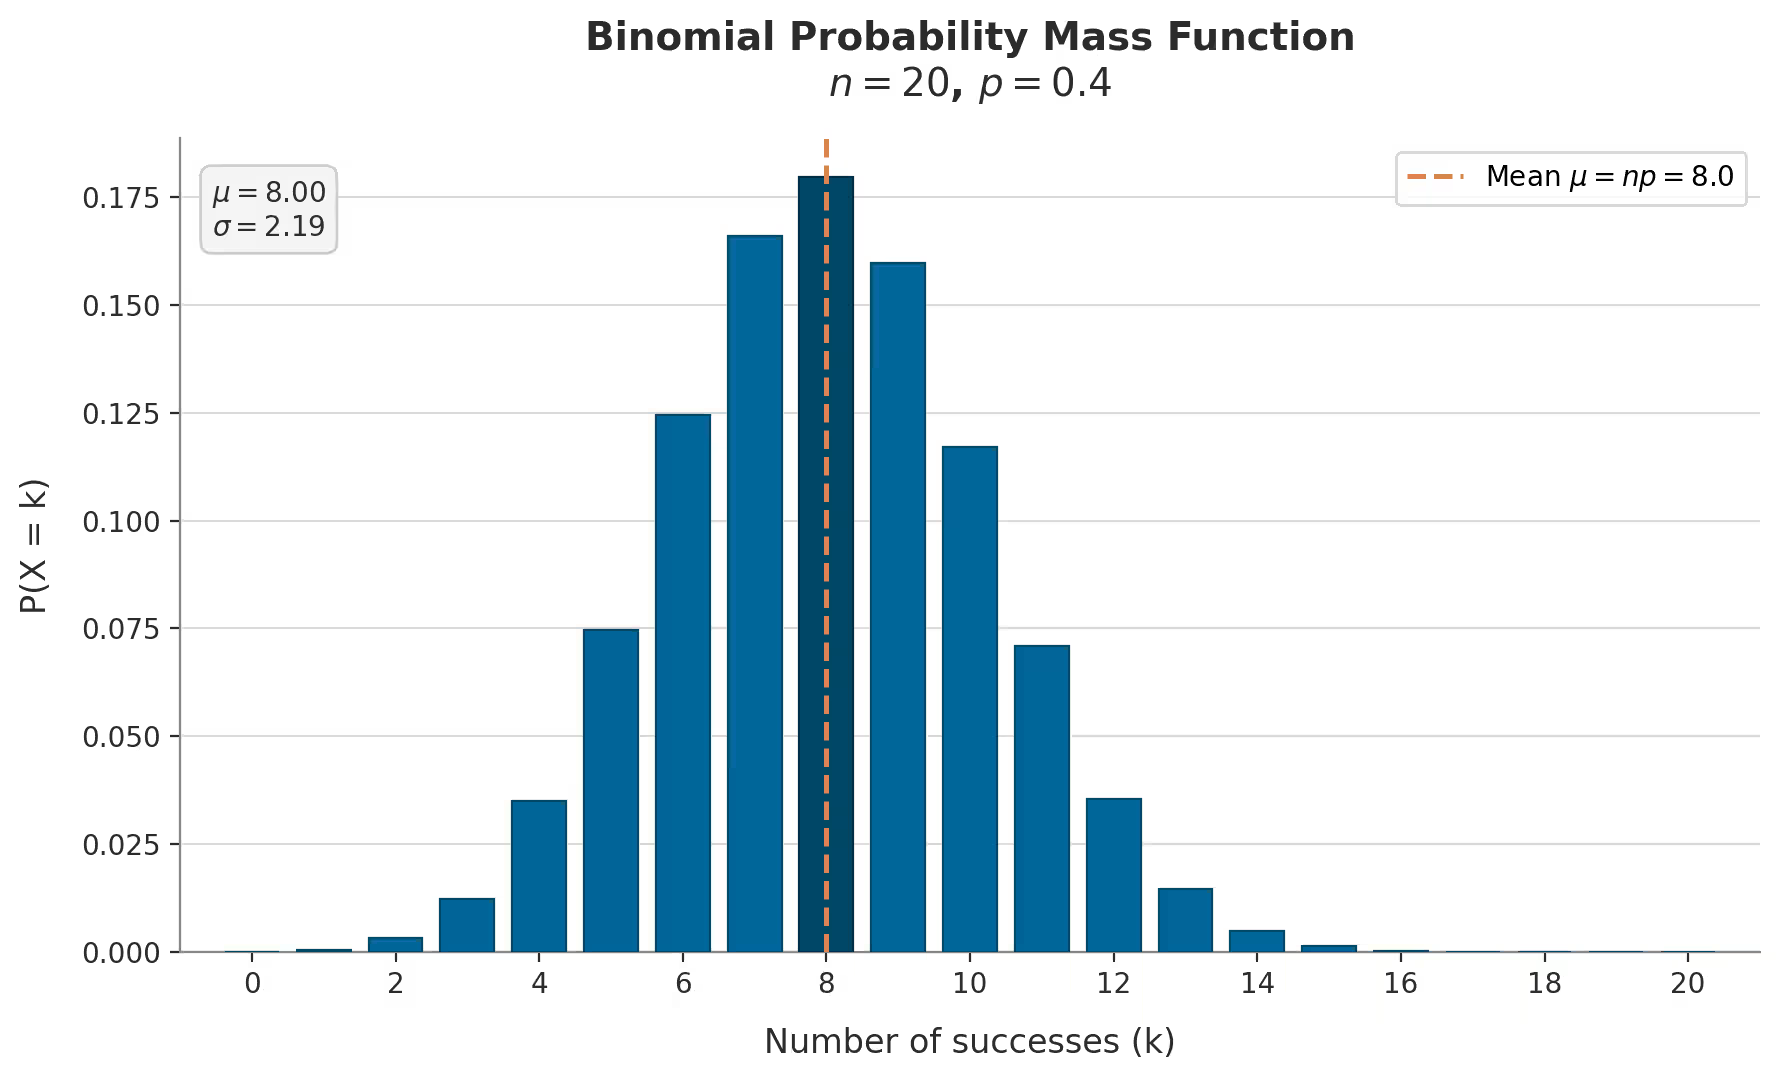
Binomial distribution is a probability distribution, widely used to model the number of successes in a fixed number of independent random trials, where each trial has only two possible outcomes: success or failure. This distribution is useful for calculating the probability of a specific number of successes in scenarios like flipping coins, quality control, or survey predictions.
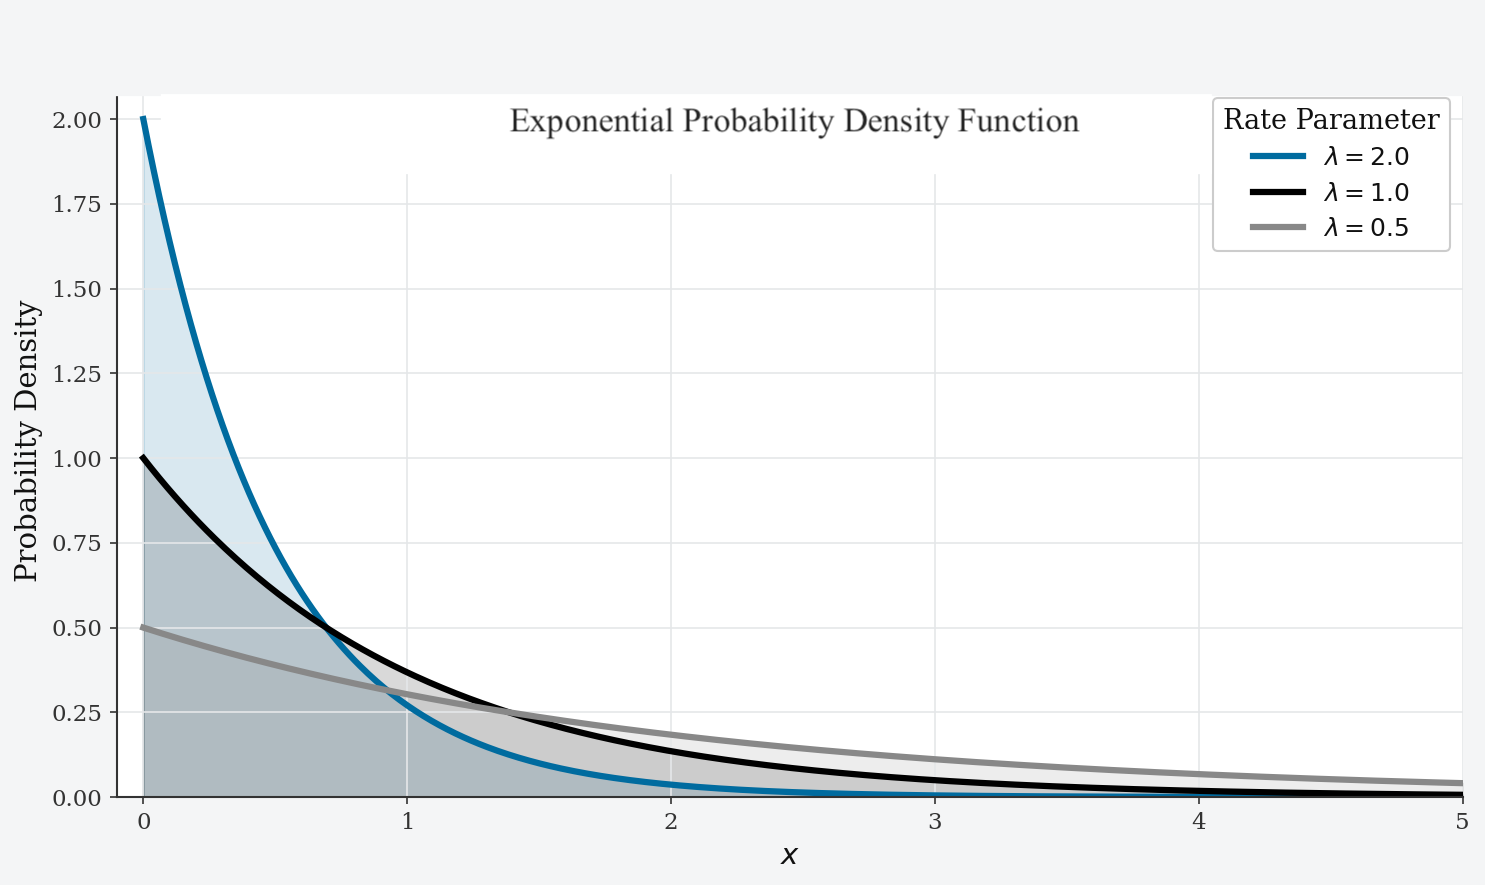
The Exponential Distribution is one of the most commonly used probability distributions in statistics and data science. It is widely used to model the time or space between events in a Poisson process. In simple terms, it describes how long you have to wait before something happens, like a bus arriving or a customer calling a help center. For example, if buses arrive at a bus stop every 15 minutes on average, the time you wait for the next bus can be modelled using an exponential distribution.
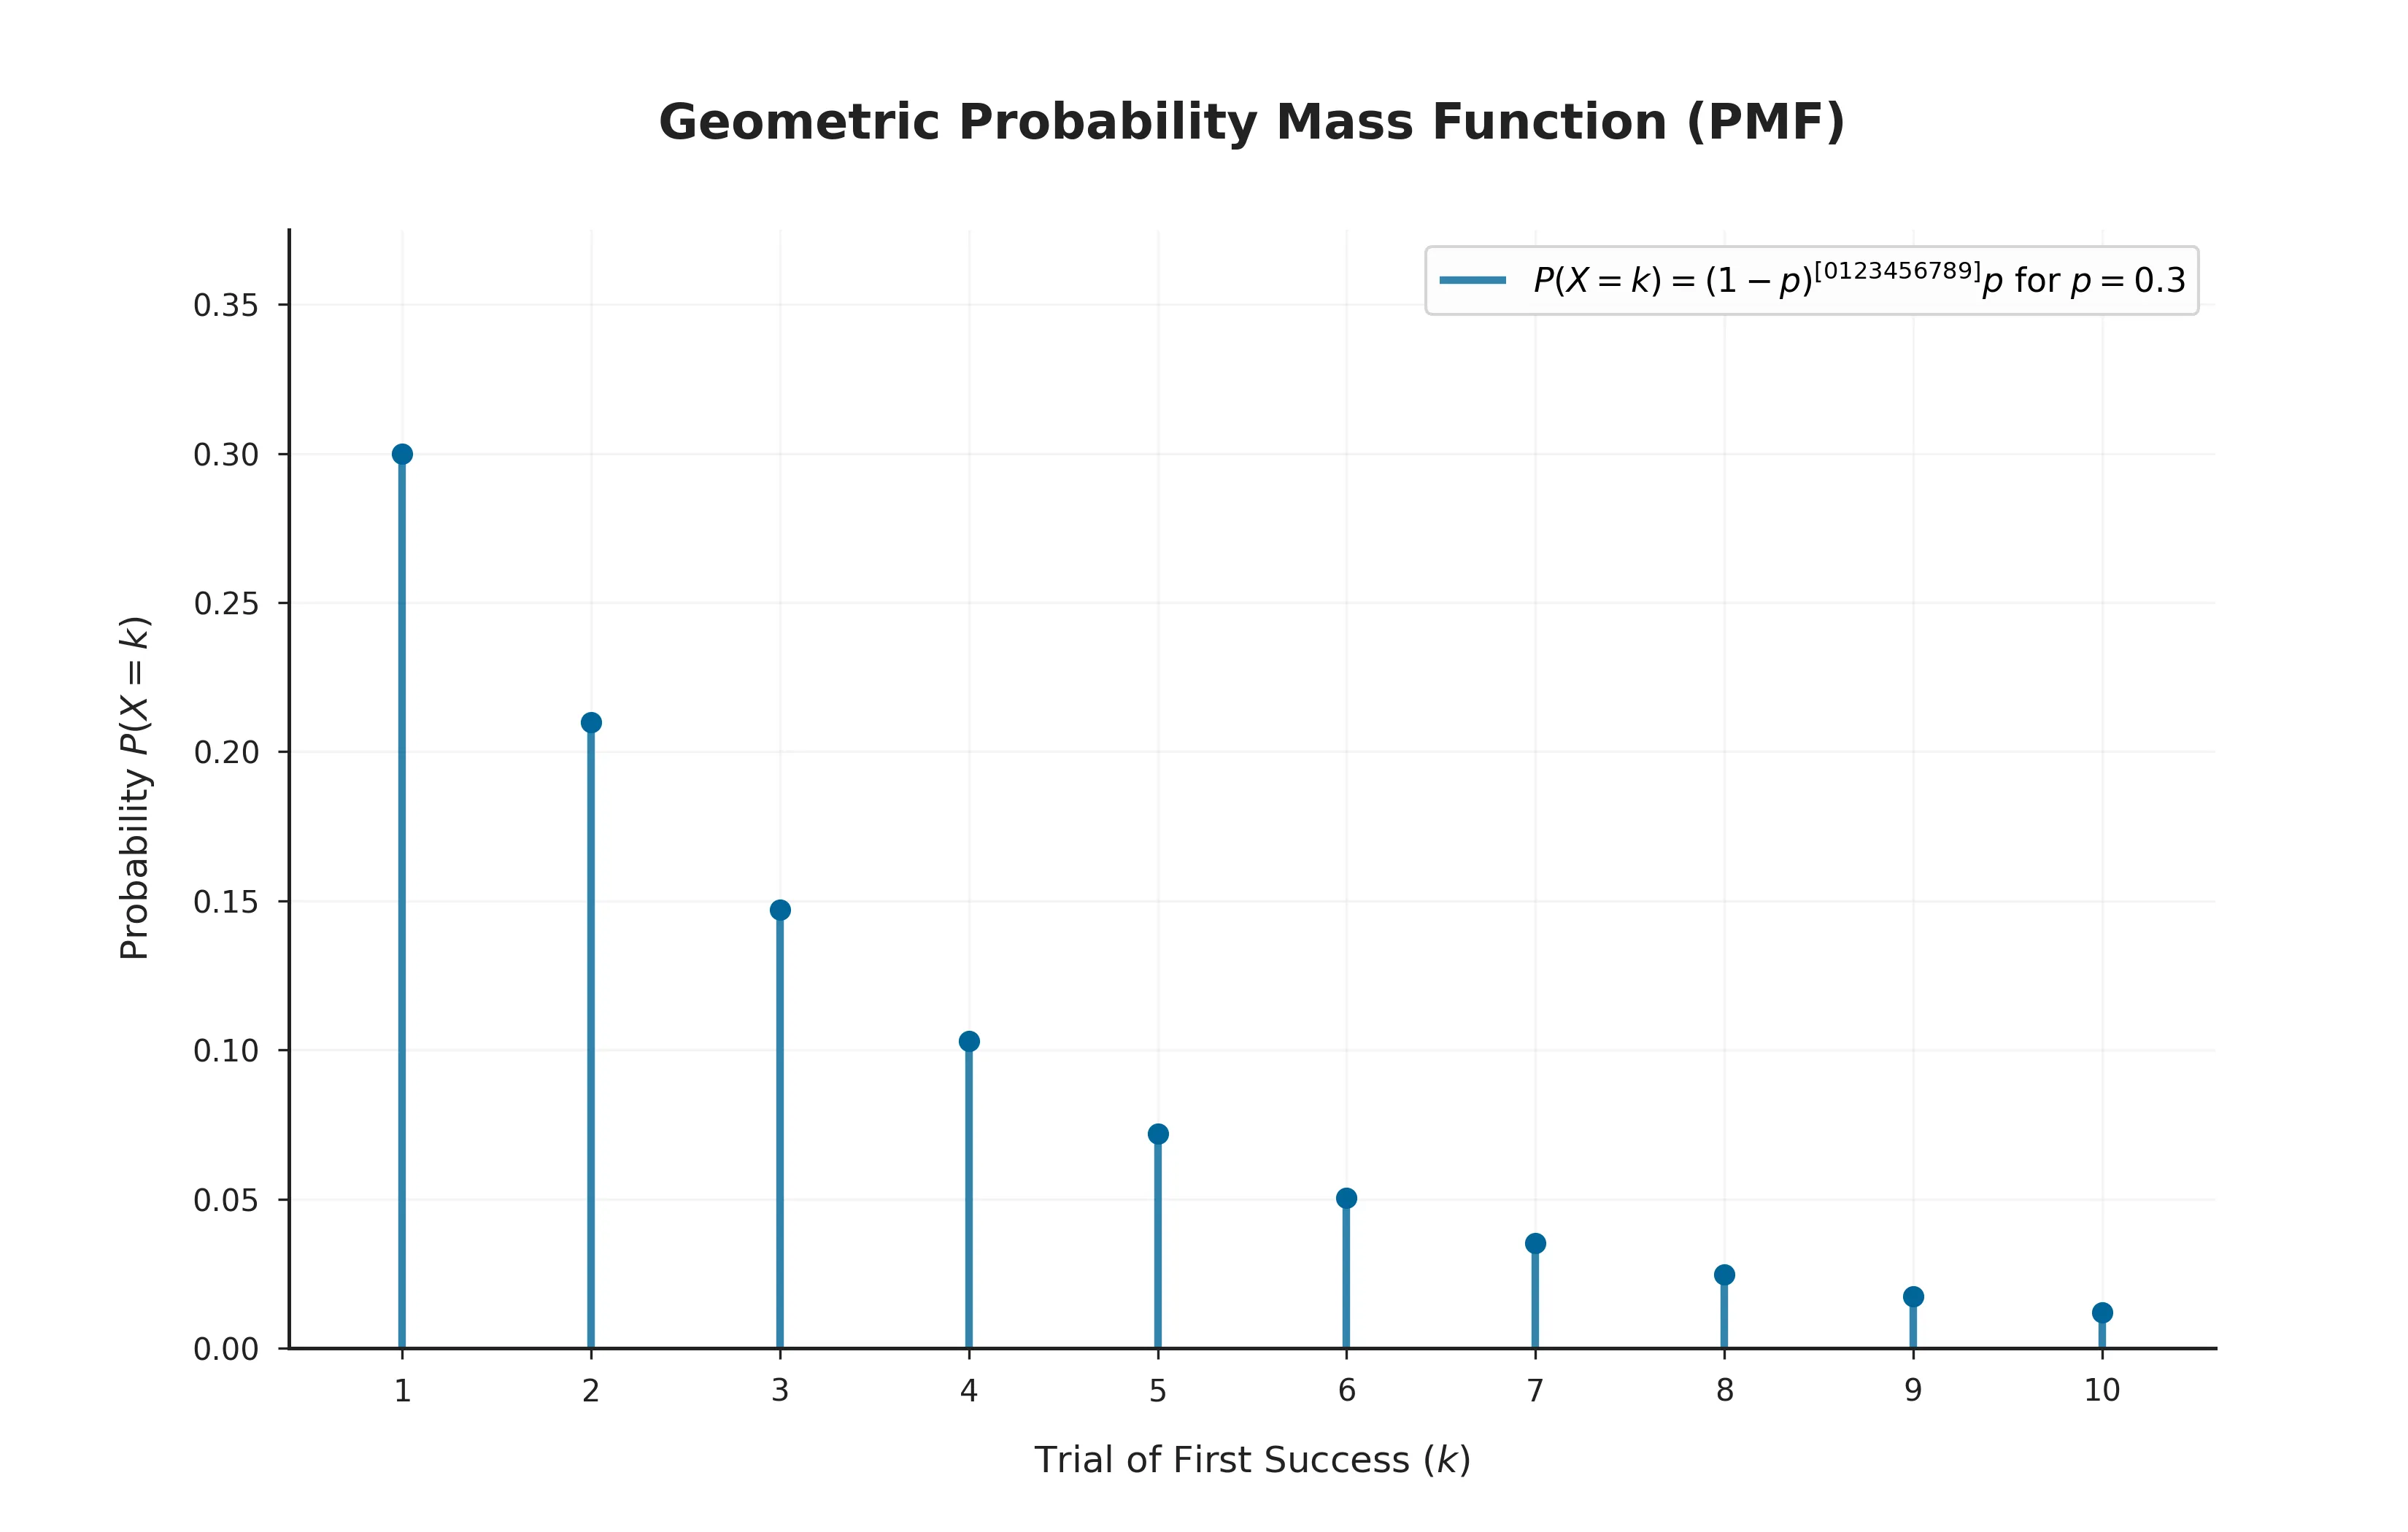
A geometric distribution is a discrete probability distribution that gives the probability that the first success occurs on a specific trial in a sequence of independent Bernoulli trials, where each trial has two outcomes, success or failure, and the probability of success, p, remains constant across trials.
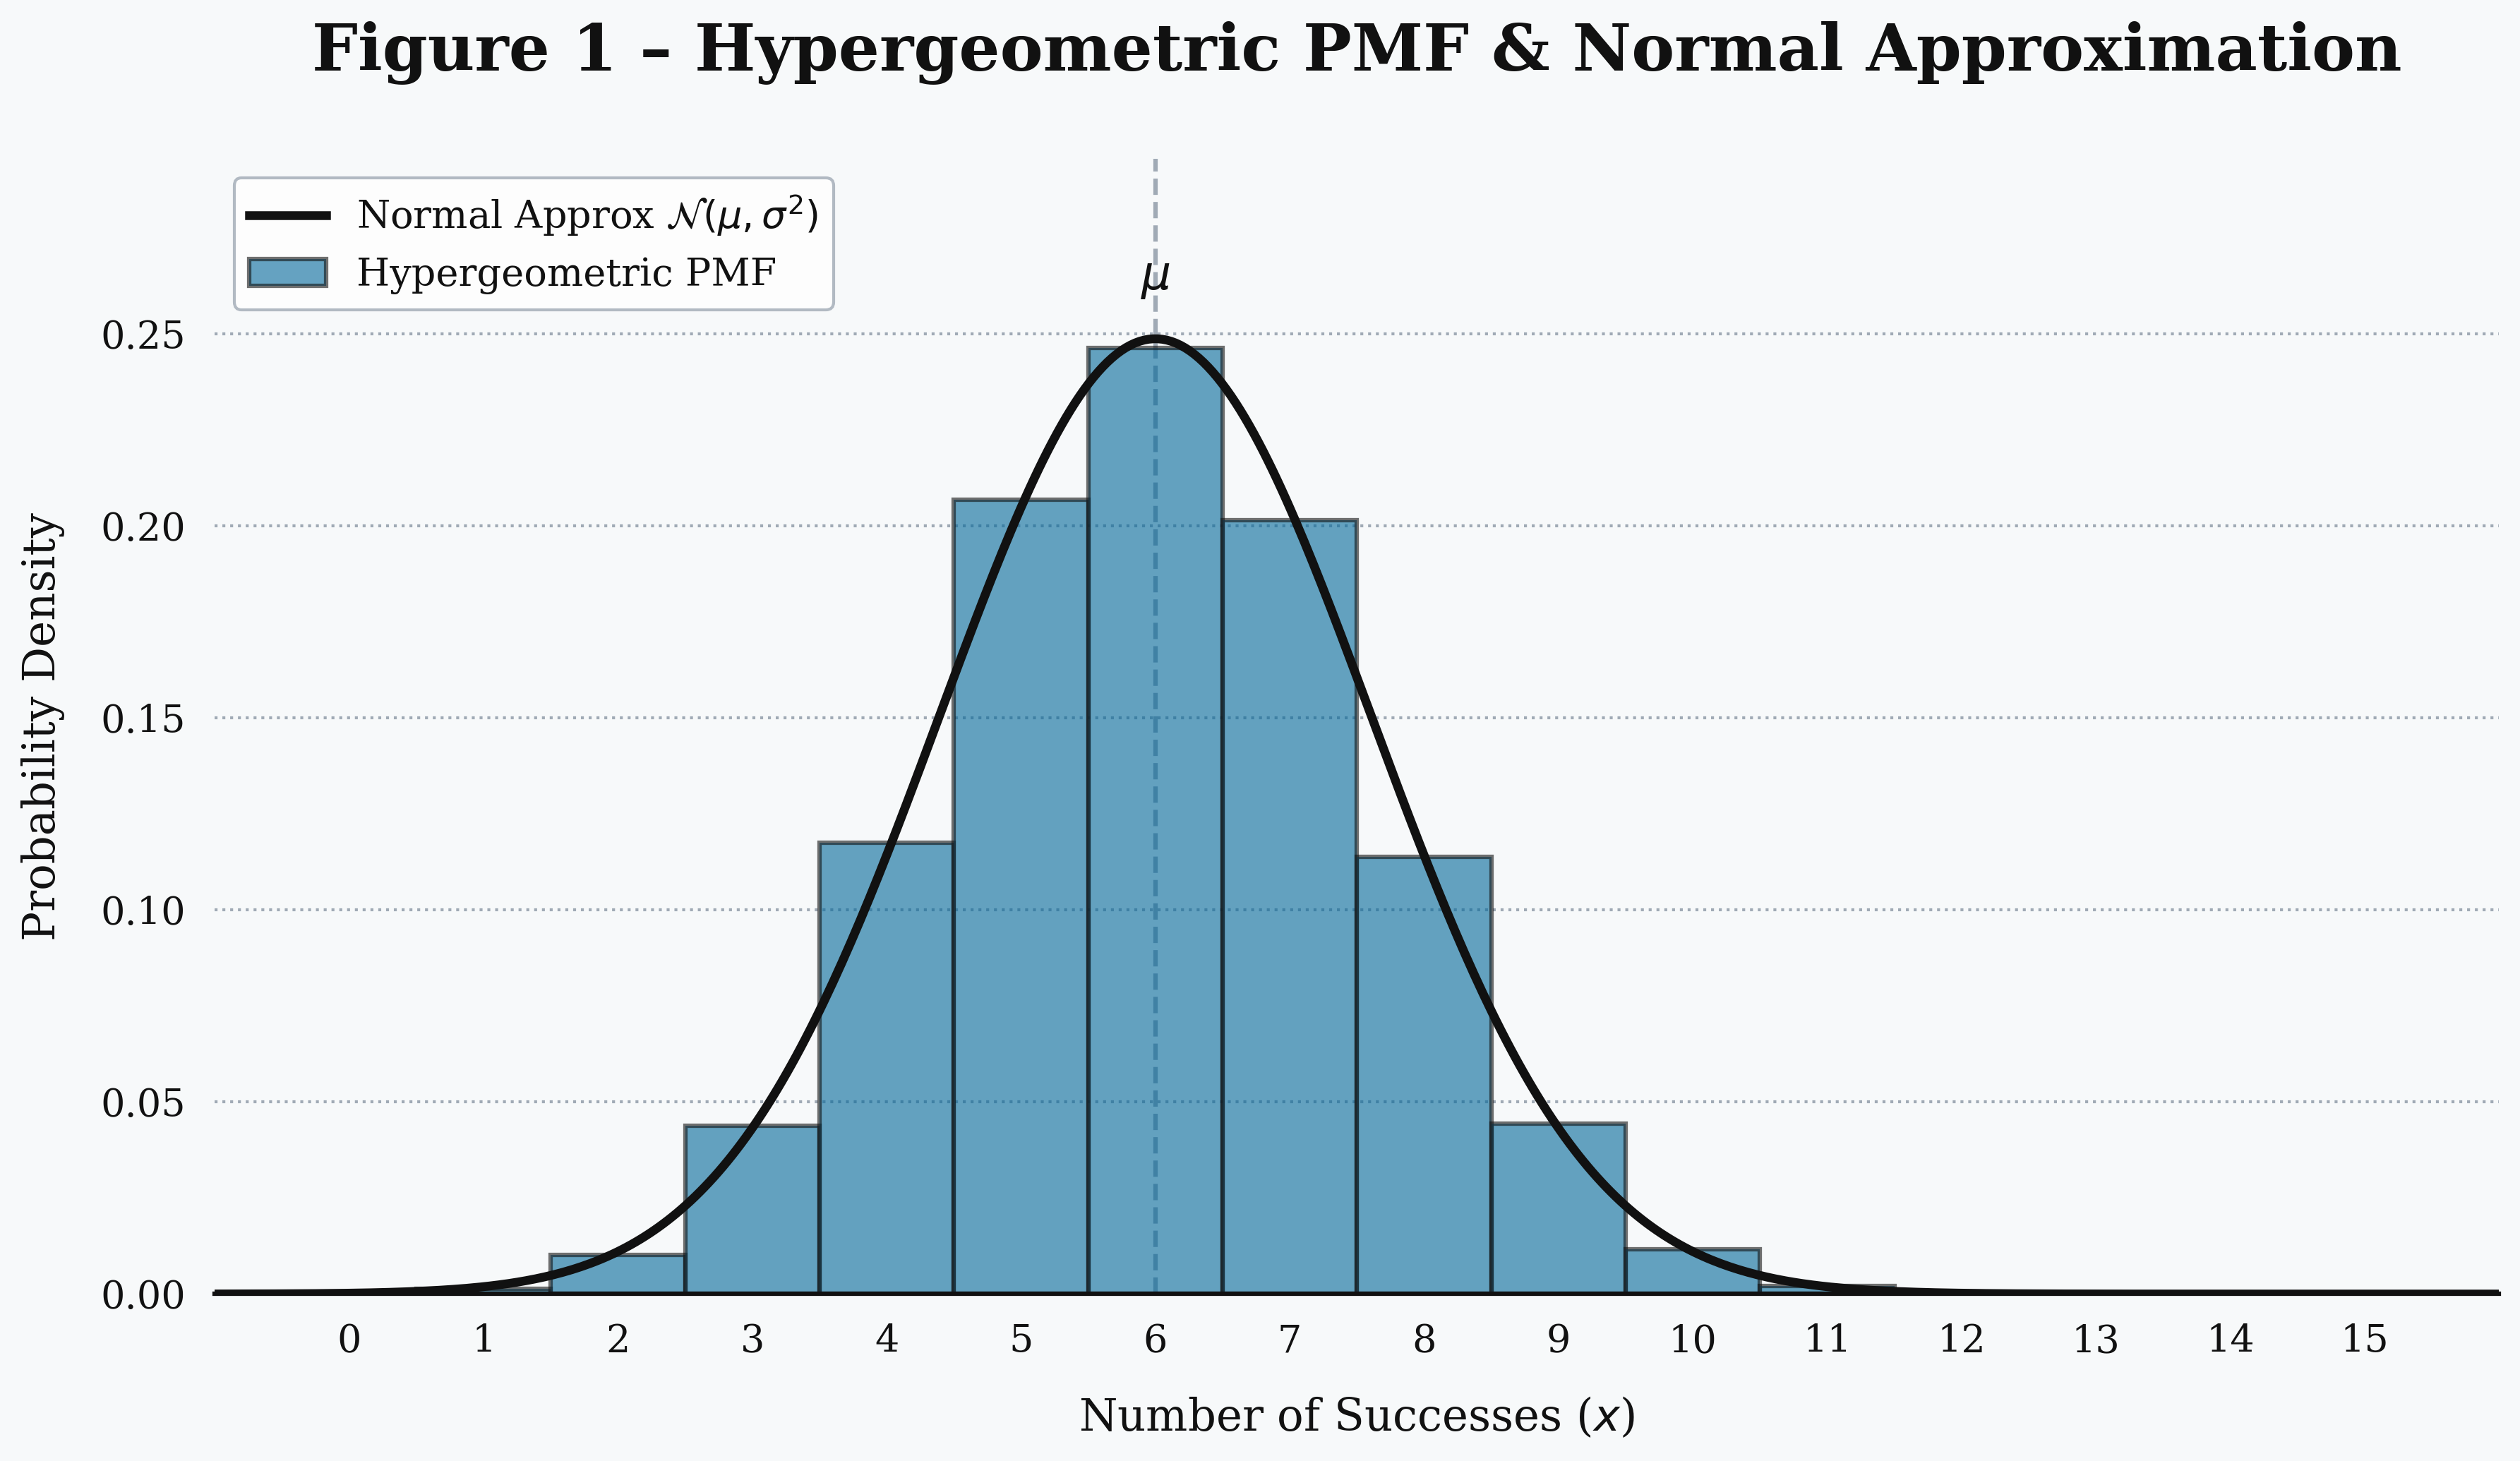
The hypergeometric distribution models the probability of obtaining a specific number of successes in a given number of draws from a finite population. Unlike the binomial distribution, which assumes replacement, the hypergeometric distribution does not replace items once they are drawn. This characteristic makes it applicable in scenarios where the population size is fixed, and the number of items is limited.
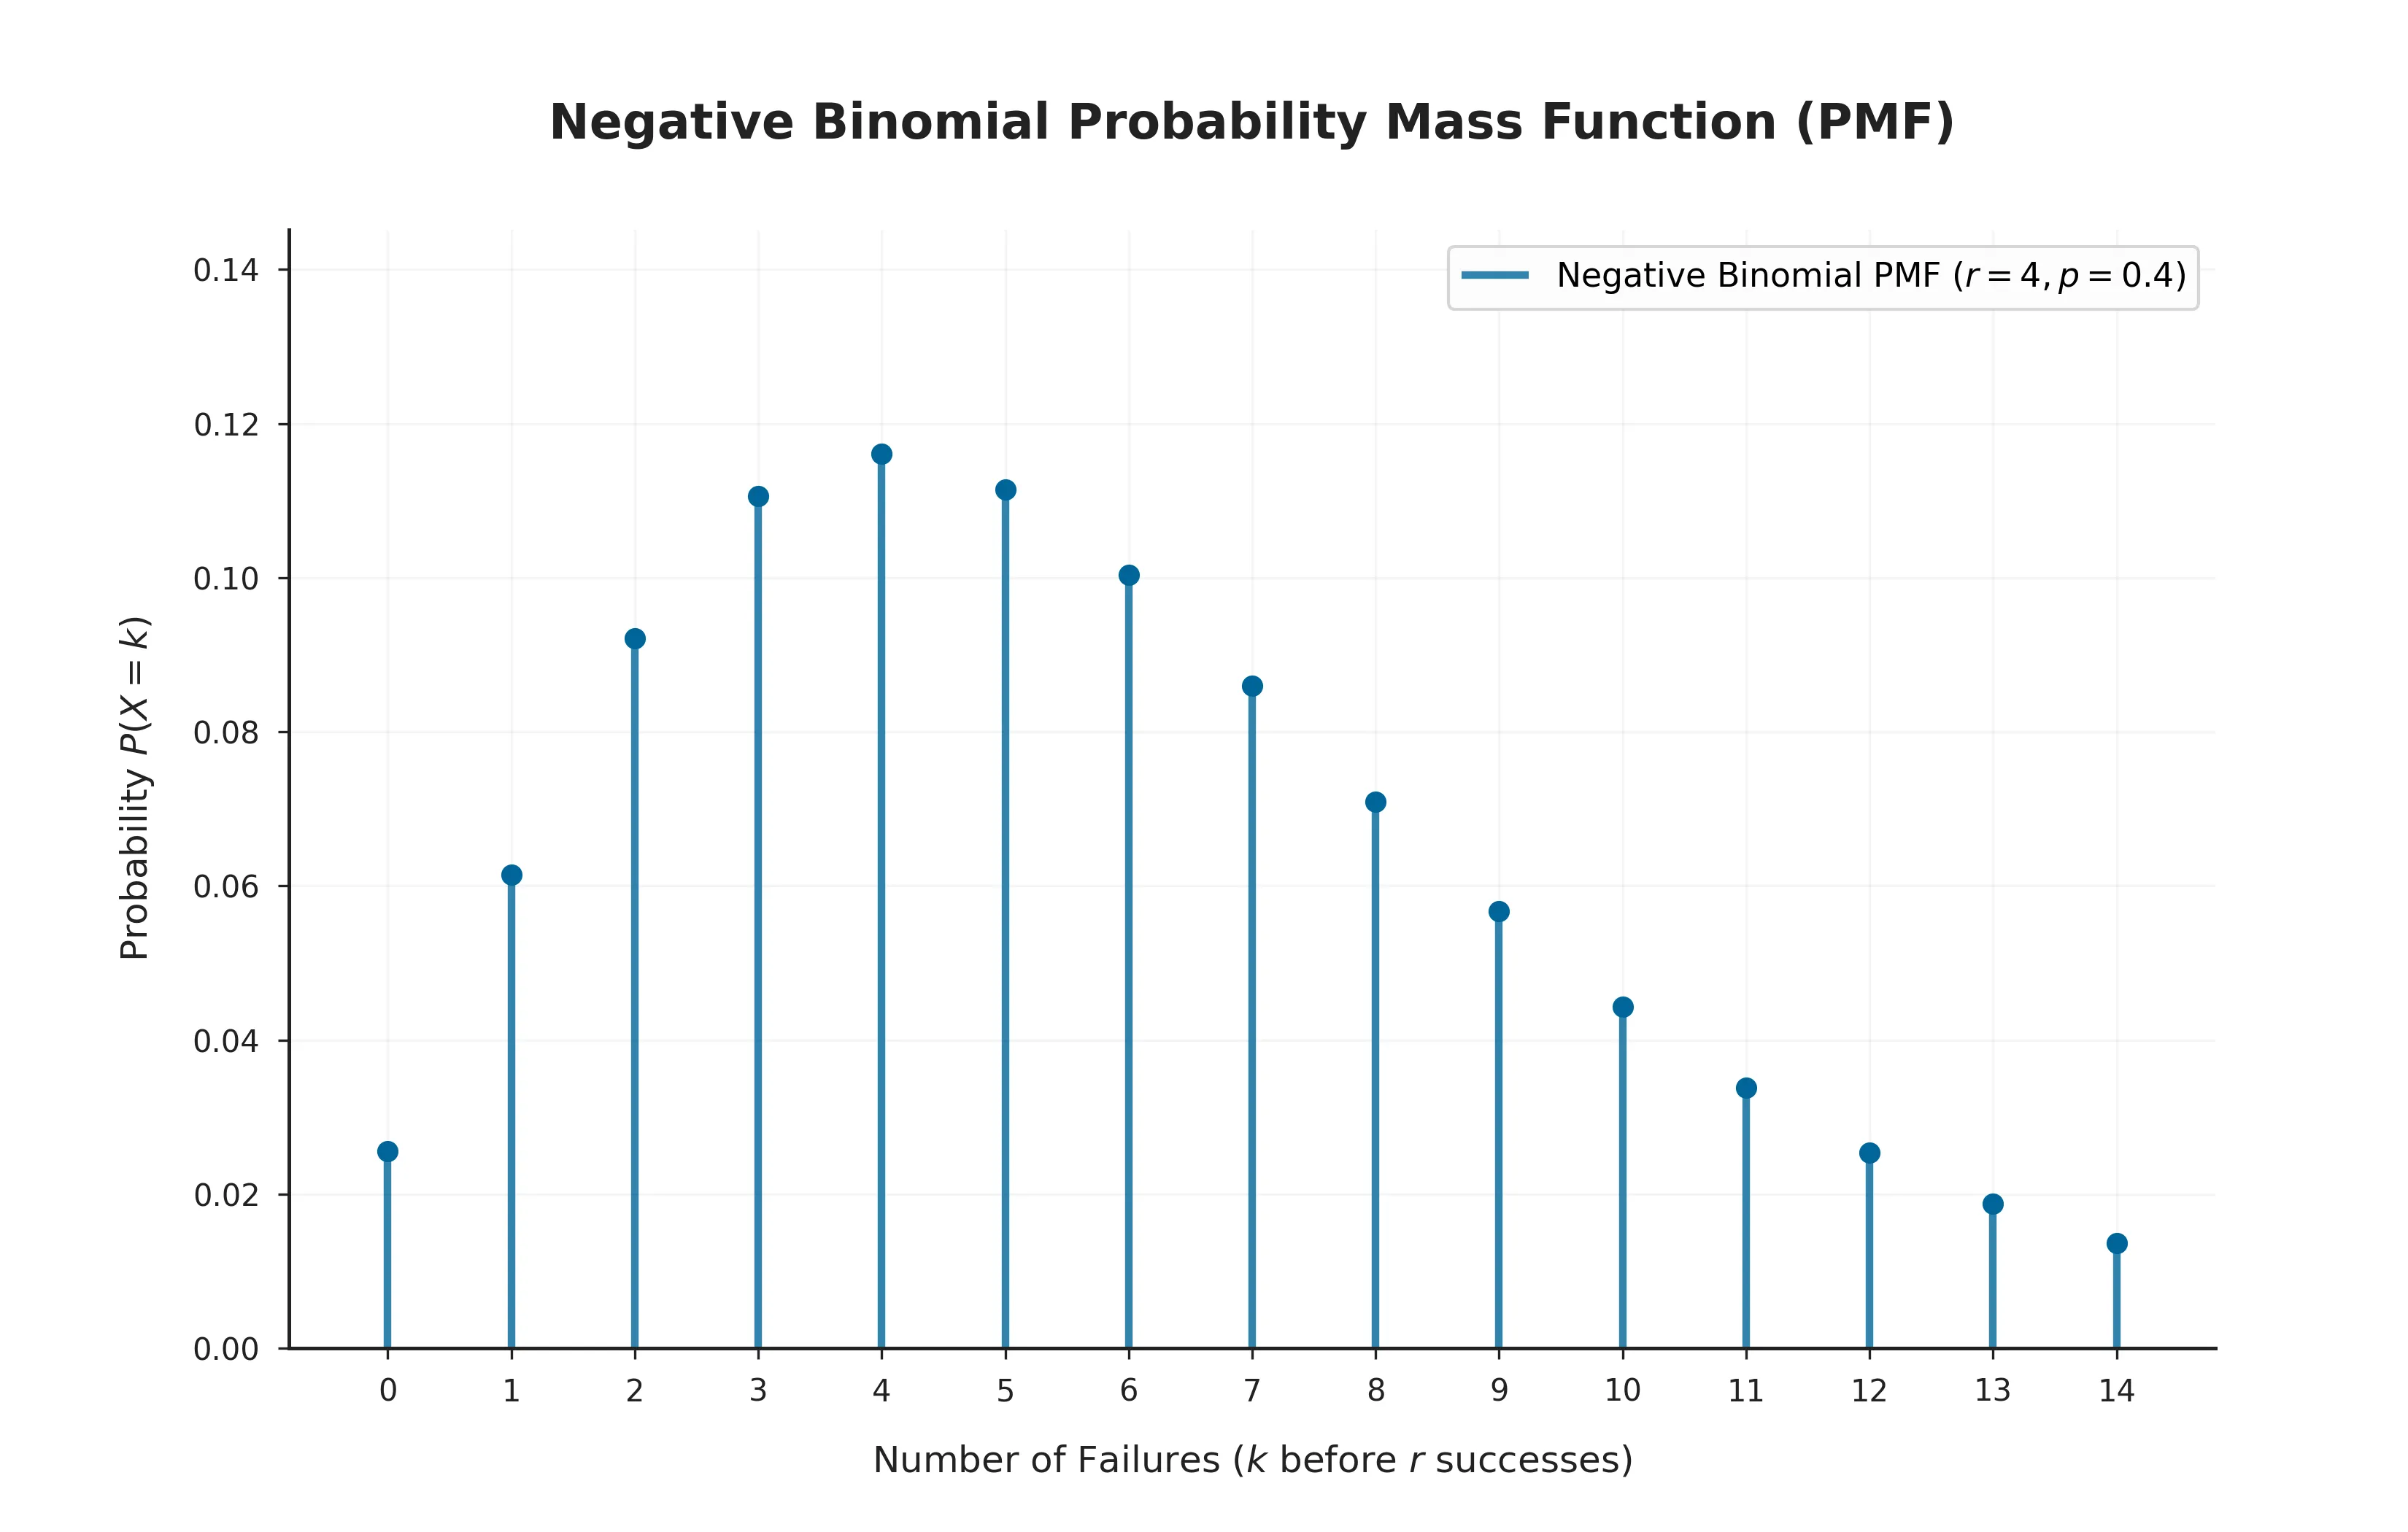
The negative binomial distribution models the number of trials needed to achieve a specified number of successes in a sequence of independent and identically distributed Bernoulli trials.
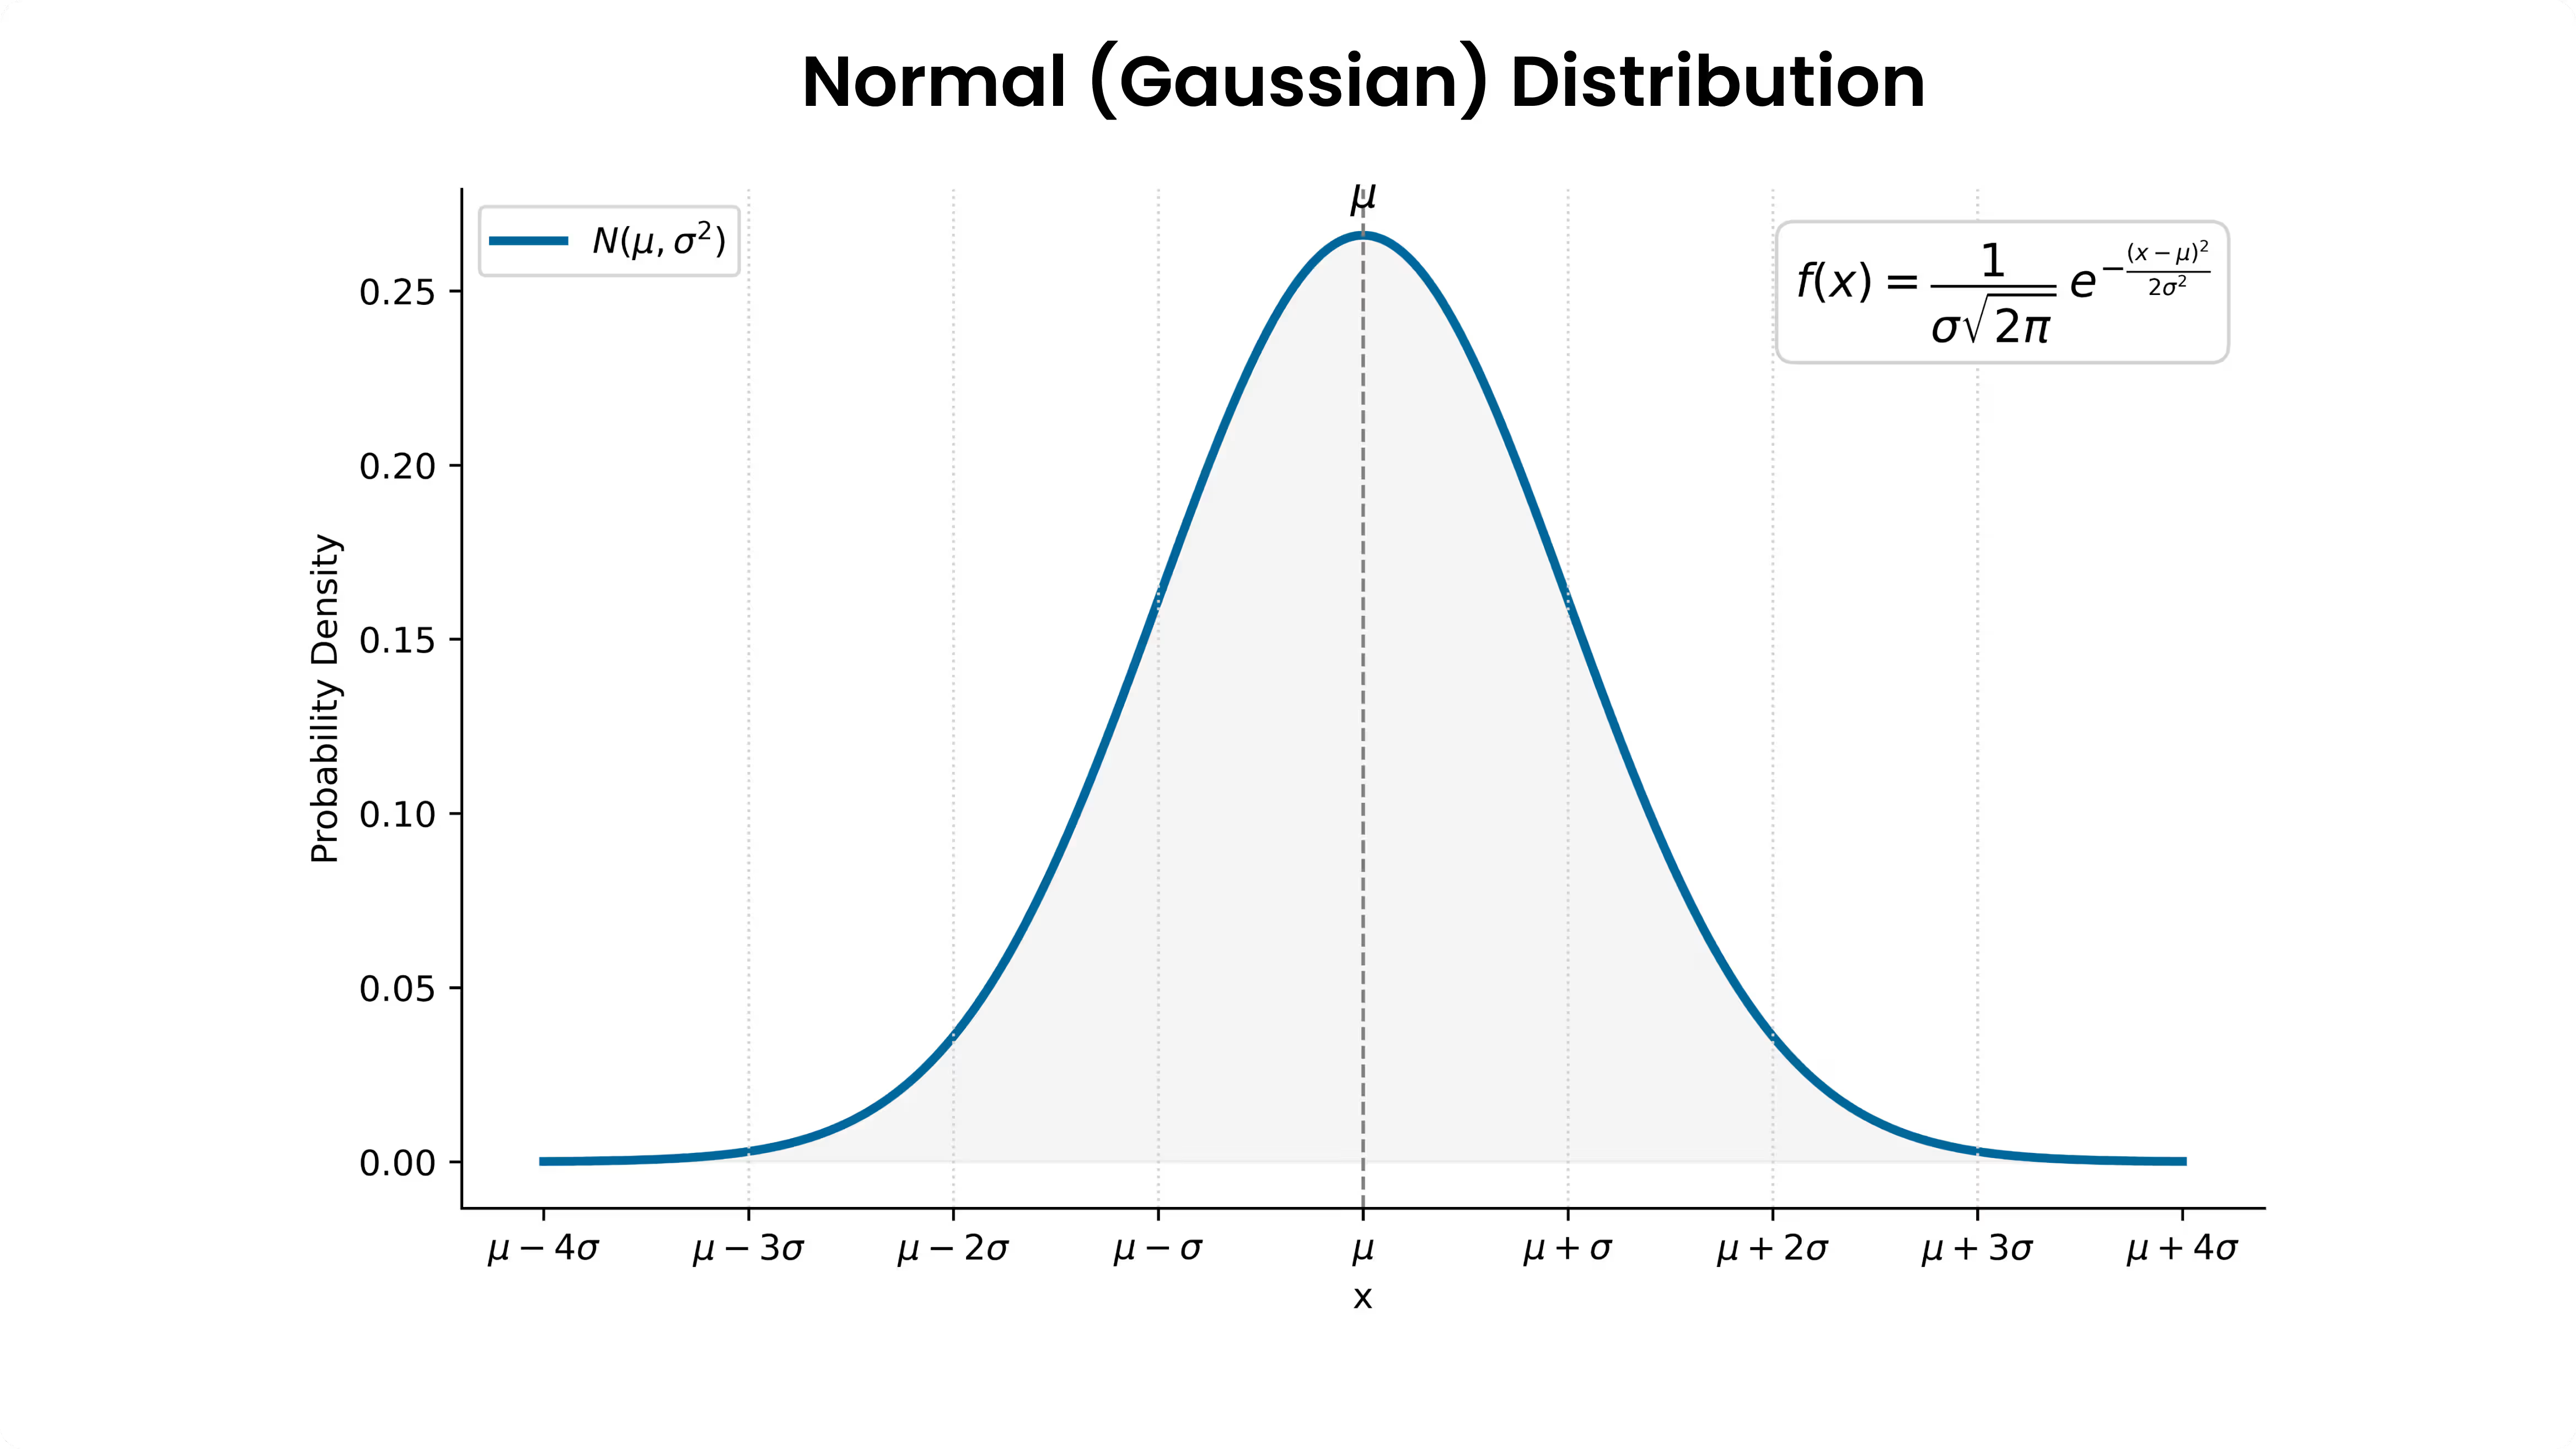
A complete, visual guide to the Normal (Gaussian) distribution: the bell curve formula, notation, mean and standard deviation, symmetry, skewness and kurtosis, the empirical rule, the standard normal table, worked examples, related distributions, and where it shows up in statistics and machine learning.
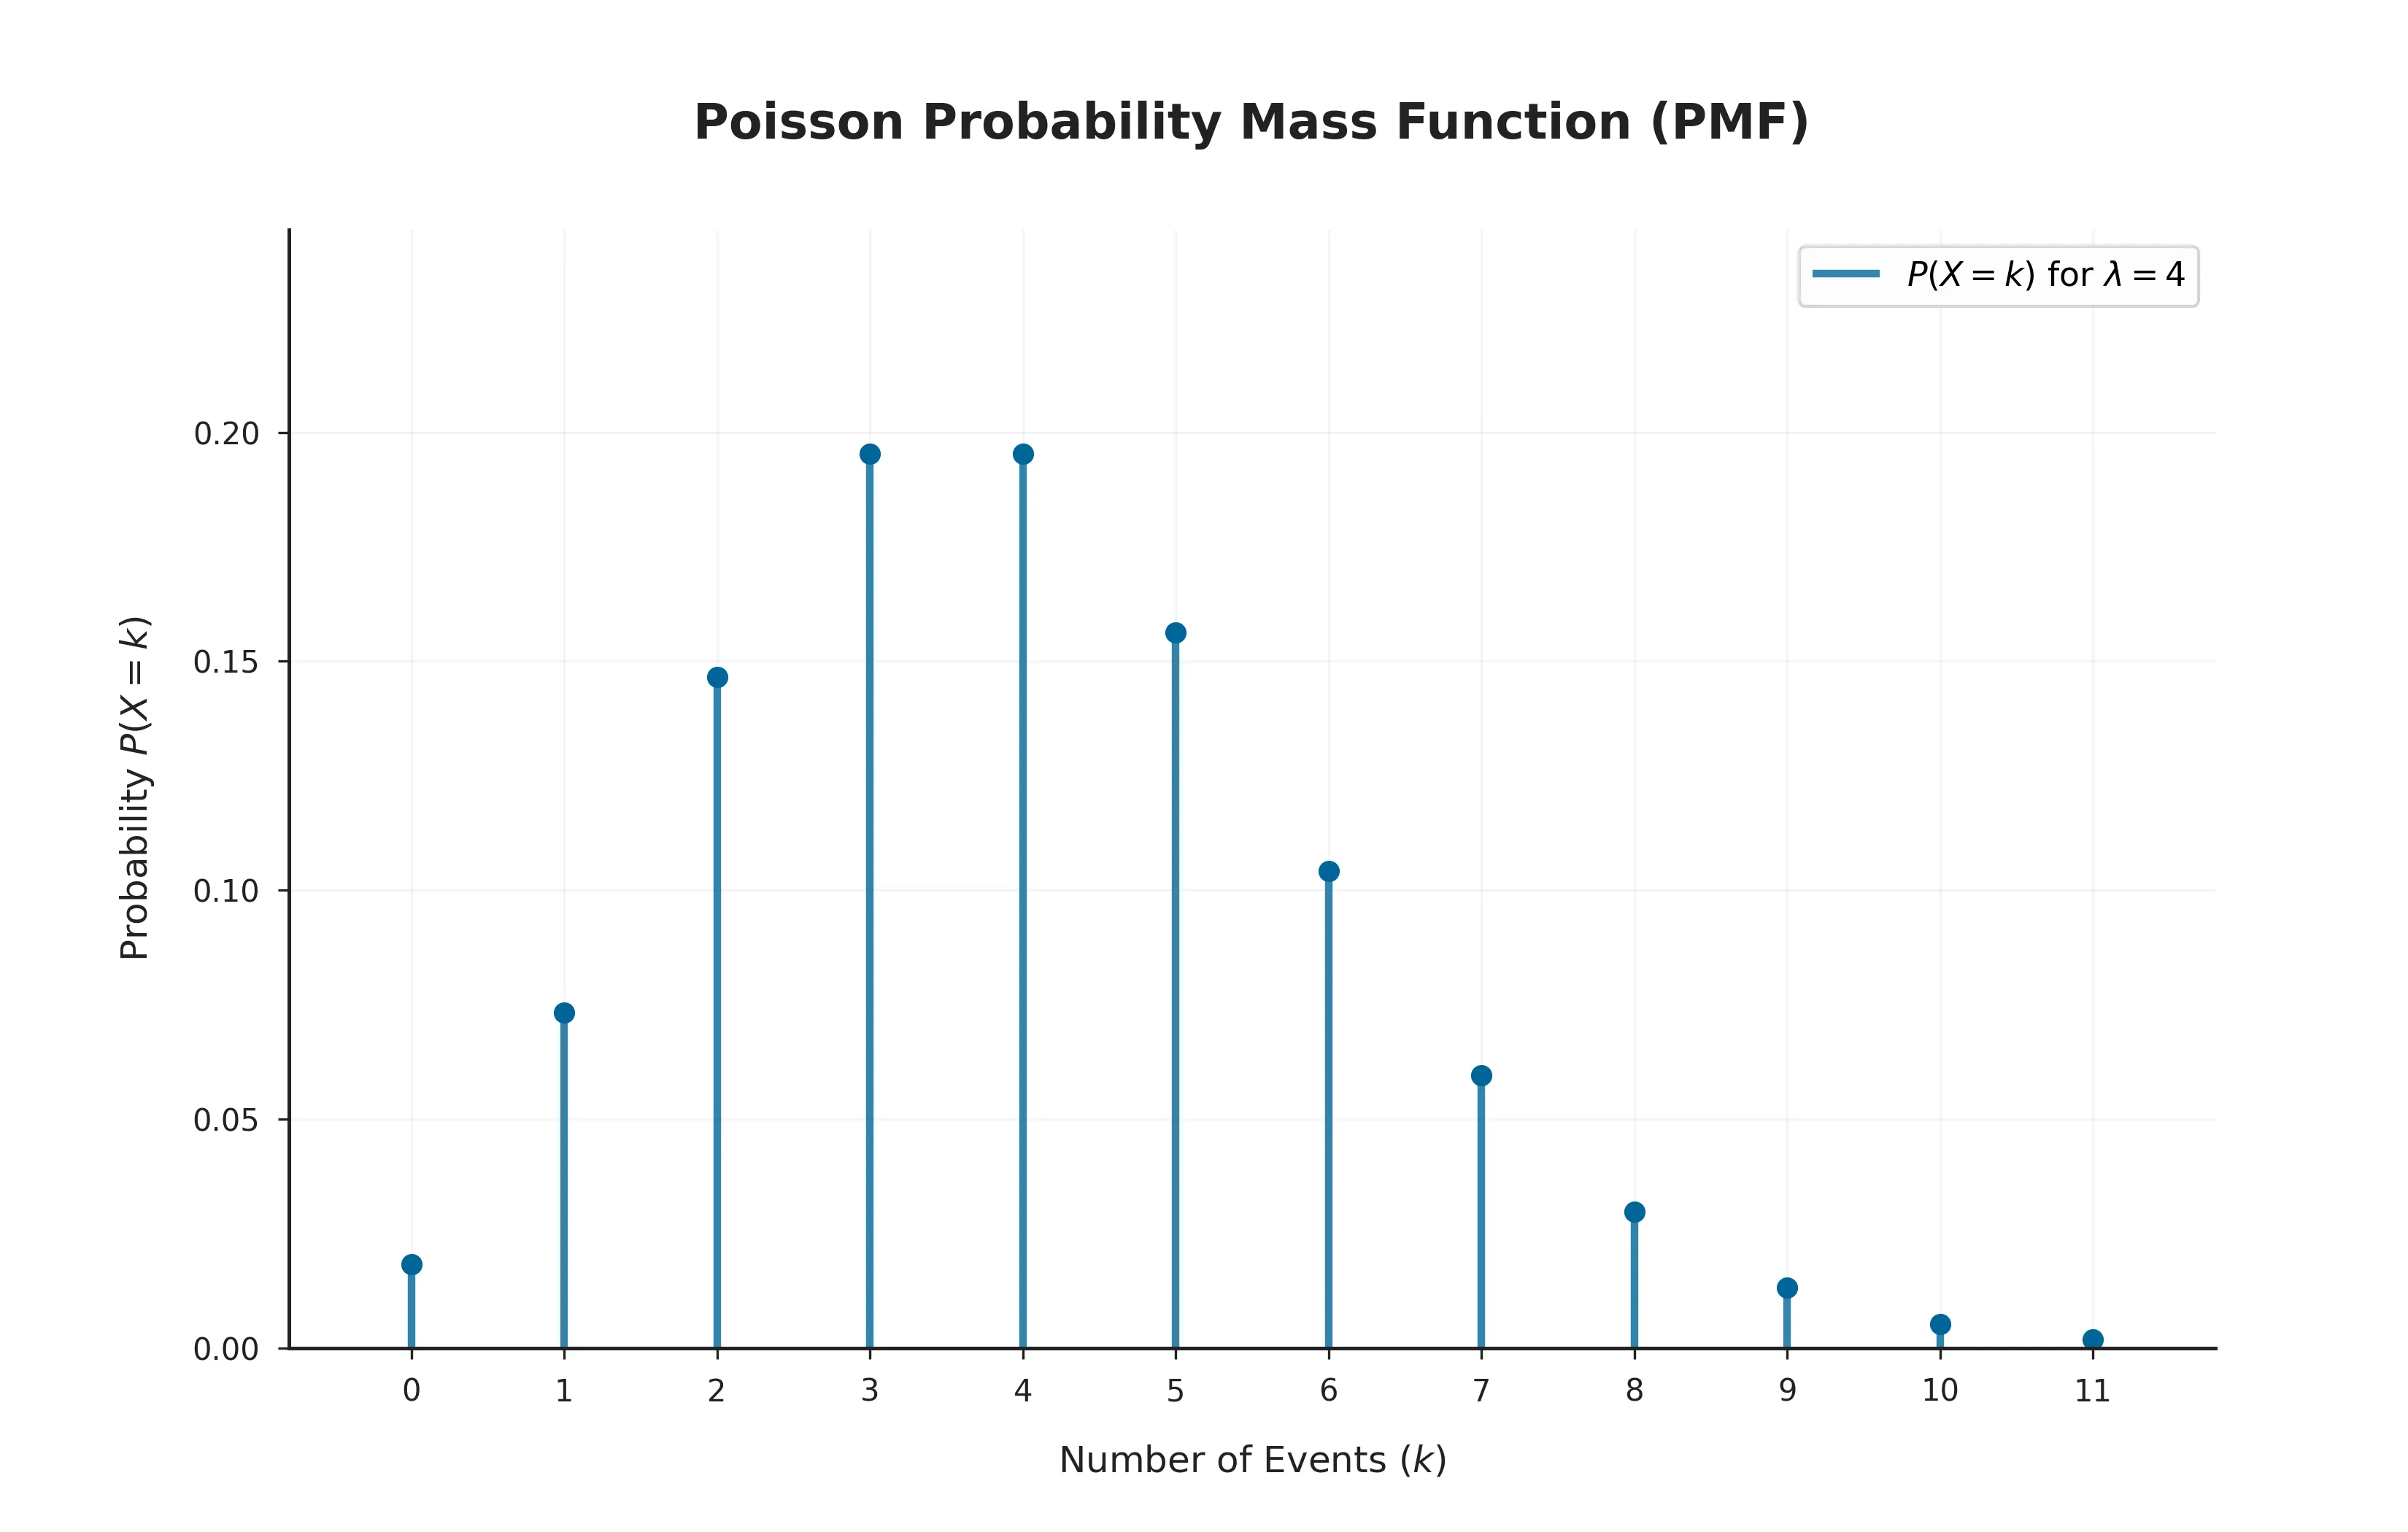
The Poisson distribution is a discrete probability distribution that calculates the likelihood of a certain number of events occurring within a fixed interval of time, assuming the events occur independently.
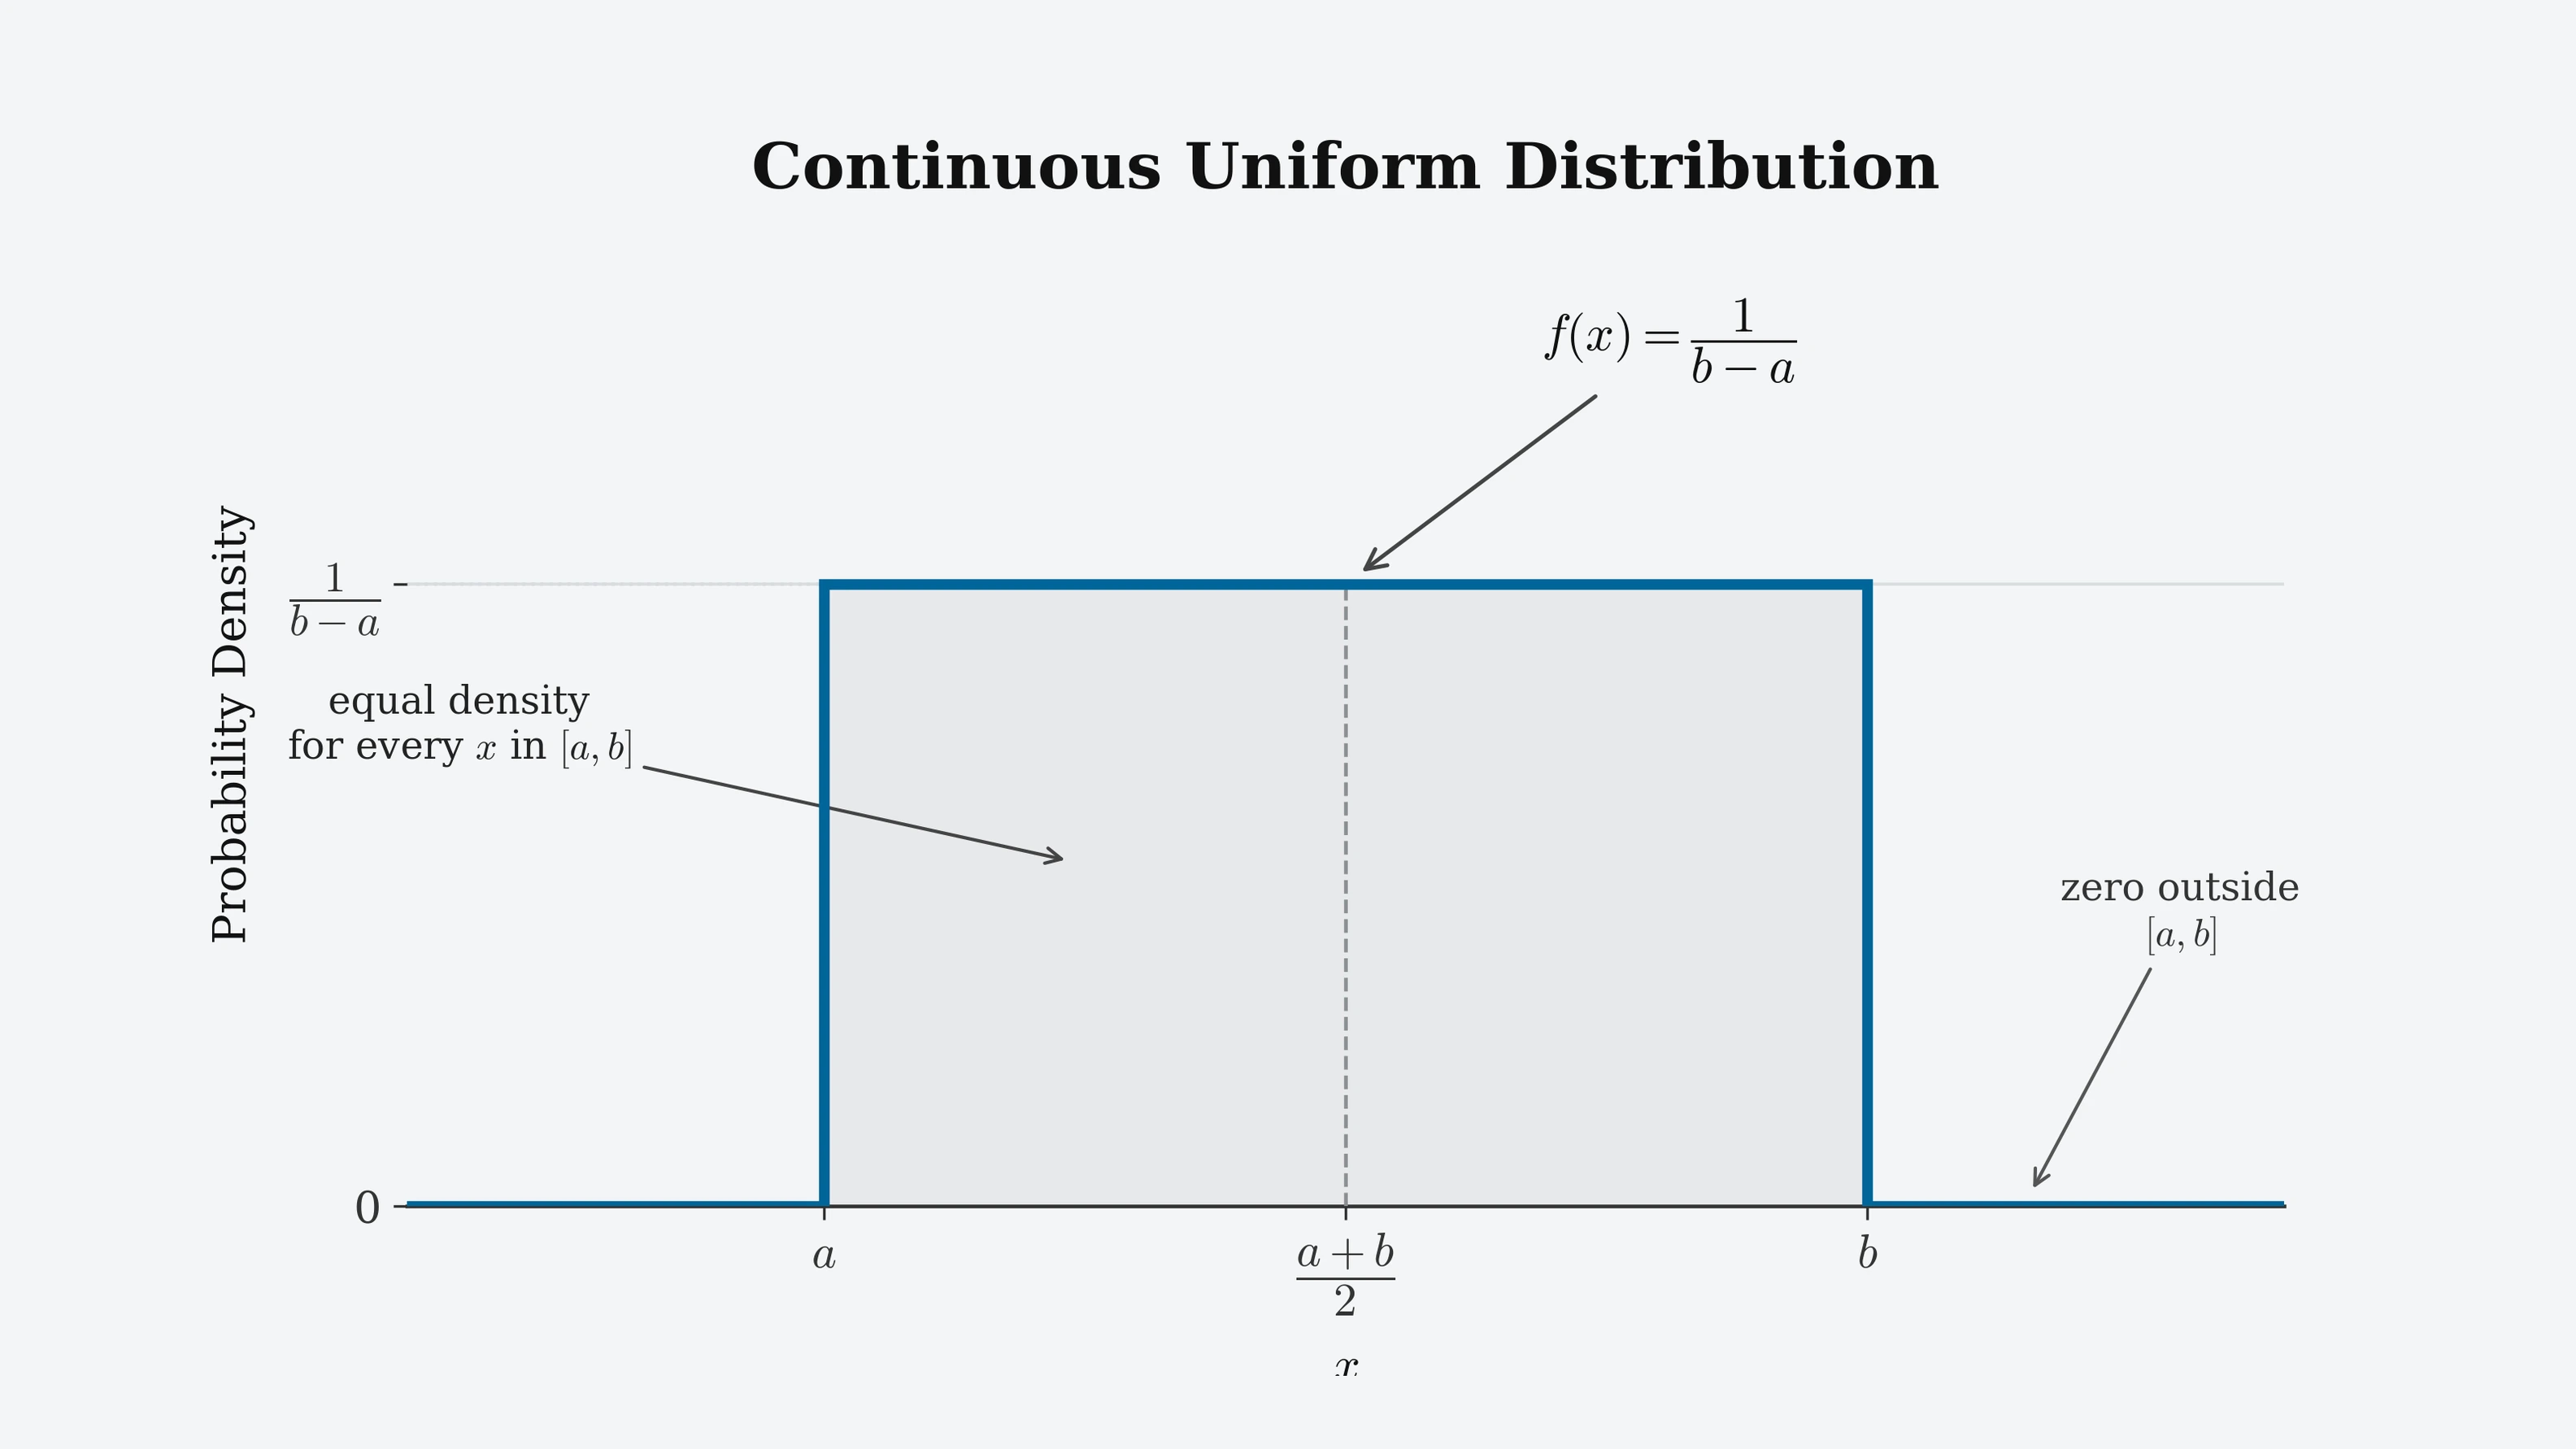
A complete, visual guide to the Uniform distribution: the discrete and continuous forms, the flat-density formula, notation, mean and variance, the CDF, moments and the moment generating function, worked examples, related distributions, and where it shows up in statistics, simulation and machine learning.